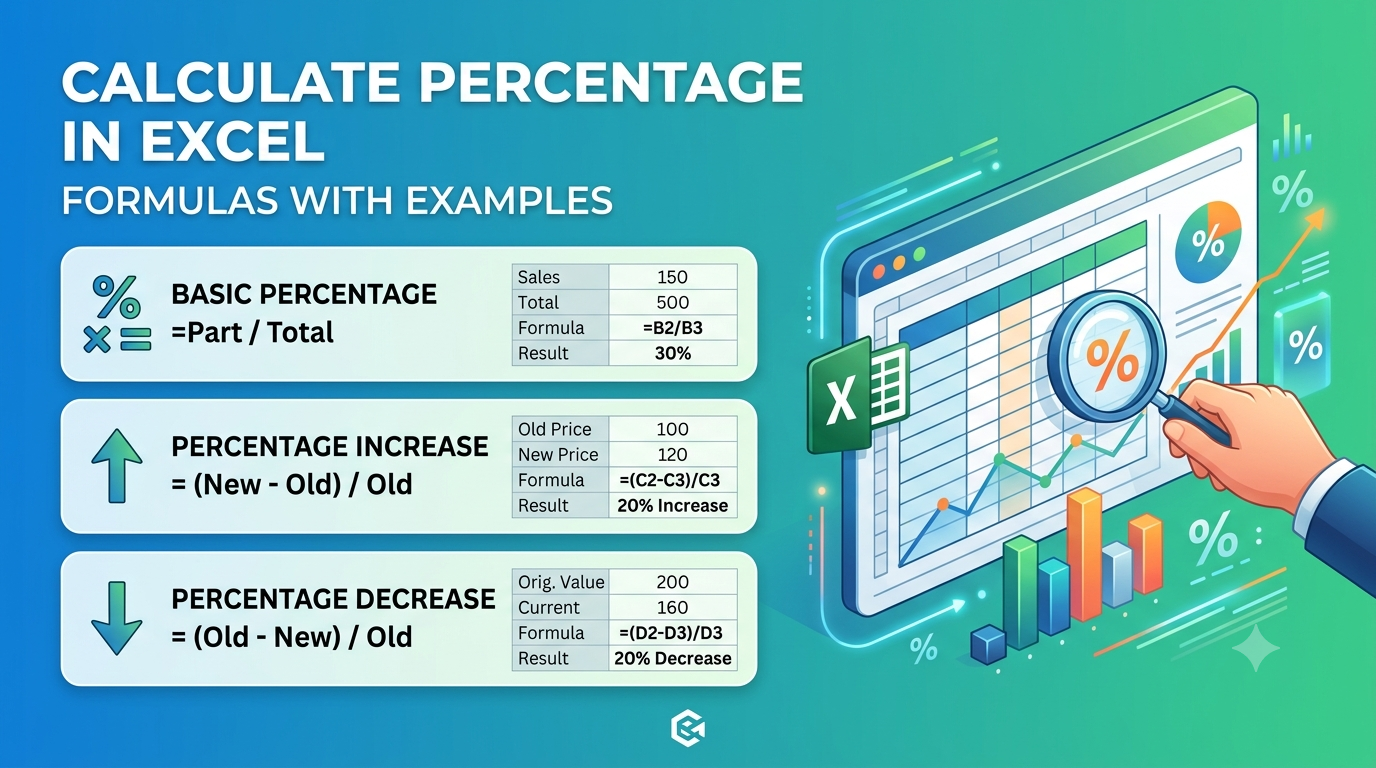
Let’s be honest: staring at a wall of numbers in an Excel sheet can be intimidating. Whether you are a student tracking your grades, a business owner monitoring monthly growth, or an aspiring data analyst, one task always comes up: calculating percentages.
The good news? You don’t need a PhD in mathematics to master this. In fact, if you know how to divide two numbers, you’ve already done the hard part. Excel does the heavy lifting for you; you just need to tell it which cells to look at.
In this guide, we’re going to break down everything you need to know to calculate percentage in Excel: formulas with examples included. We will go from the absolute basics to more advanced scenarios like percentage change and the dreaded “absolute reference” (those little dollar signs that confuse everyone).
Let’s dive in!
The Absolute Basics: How to Calculate a Simple Percentage
At its core, a percentage is just a part of a whole. The mathematical formula is:
(Part / Total) × 100
However, in Excel, you don’t actually need to multiply by 100. Why? Because Excel has a built-in “Percent Style” button that does that for you automatically.
Step-by-Step: The Basic Formula
Imagine you have a test score. You scored 40 marks out of 50.
- Cell B2 (Part): 40
- Cell C2 (Total): 50
Step 1: In an empty cell (D2), type this formula:
Step 2: Press Enter. You’ll likely see a decimal like .
Step 3: With cell D2 selected, go to the Home tab and click the Percent Style (%) button in the Number group.
Step 4: Boom! Your becomes .
Calculating Percentages for Multiple Rows
In the real world, you rarely calculate just one percentage. You probably have a list of 50 students or 100 products. You don’t want to type the formula 100 times—that’s what the Fill Handle is for.
Calculate Percentage in Excel: Formulas With Examples
Example: Student Grade Sheet
Imagine a table where you have total marks obtained in Column L and the maximum possible marks in Column M.
- Write the formula for the first row: In cell N3, enter
. - Format as %: Click the
button in the Home tab. - Drag to fill: Click the small green square in the bottom-right corner of cell N3 and drag it down to the end of your list.
Excel is smart. When you drag the formula down, it automatically changes to , , and so on. This is called Relative Referencing, and it is the secret to working fast in Excel.
How to Calculate the Percentage of a Total
This is where things get a bit trickier. Let’s say you have a list of products and their sales, and you want to know what percentage of the grand total each product contributes.
The Problem: If you use a regular formula and drag it down, Excel will move the “Total” cell reference down too, and your calculations will break.
The Solution: The Dollar Sign ($)
To keep the “Total” cell locked in place, we use Absolute Referencing.
Example Scenario:
- Product Sales are in cells B4, B5, and B6.
- The Grand Total is in cell B7 (calculated using
).
The Formula:
In cell C4, enter:
Why the signs? The tells Excel: “Do not move this reference when I drag the formula.”
- When you drag the formula down to C5, it becomes
. - When you drag it to C6, it becomes
.
The product changes, but the total stays locked on B7.
Percentage Change vs. Percentage Difference
People often confuse these two, but they serve very different purposes.
1. Percentage Change (The “Before and After”)
Use this when you have an old value and a new value and want to see the growth or decline. For example, tracking website traffic from January to February.
Formula:
Example:
- January Visits (Old): 48,000 (Cell B4)
- February Visits (New): 60,000 (Cell C4)
- Formula:
→ Result:
2. Percentage Difference (The “Side-by-Side”)
Use this when you are comparing two things that don’t have a “starting point.” For example, comparing two different price quotes from two different vendors.
Formula:
Example:
- Vendor A: $18,500
- Vendor B: $20,000
- Formula:
Note: The function ensures the result is always a positive number, as “difference” is usually measured in absolute terms.
How to Increase or Decrease a Number by a Percentage
Ever had to apply a 10% price hike or a 15% discount across a whole inventory? You don’t need to calculate the discount first and then subtract it. You can do it in one step.
To Increase a Value (Price Hike/Salary Raise)
Formula:
Example: Increase a salary of $50,000 (B6) by 15% (C6).
- Formula:
- Logic: 50,000×1.15=$57,500
To Decrease a Value (Discounts/Price Cuts)
Formula:
Example: Apply a 10% discount to a price of $70,000 (B12) (C12).
- Formula:
- Logic: 70,000×0.90=$63,000
Common Mistakes and How to Fix Them
Even pros make mistakes in Excel. If your numbers look weird, check this troubleshooting guide:
| The Problem | Why it happened | The Quick Fix |
|---|---|---|
| Showing 0.75 instead of 75% | You haven’t applied the formatting. | Click the |
| Showing 7500% instead of 75% | You multiplied by 100 and clicked the % button. | Remove the |
| DIV/0! Error | You are trying to divide by a cell that is empty or zero. | Use an IF guard: |
| Wrong totals when dragging | You forgot the |
Change |
| Number is too rounded | Excel is hiding the decimals. | Click “Increase Decimal” in the Number tab. |
Elevate Your Career with Data Analytics
Mastering percentages is a great first step, but if you enjoy this kind of logic, you might have a future in data analysis. Data analysts don’t just calculate percentages; they use these numbers to tell stories, predict trends, and help businesses make millions of dollars.
If you want to move beyond basic formulas and dive into SQL, Python, and Machine Learning, checking out a professional Data Analyst Course (like the one offered by Kaashiv Infotech) can be a game-changer for your career.
Final Key Takeaways
To wrap everything up, here is your “cheat sheet” for calculating percentages in Excel:
- Basic Percentage:
→ Format as. - Quick Format: Use
. - Locking Cells: Use
(e.g.,) to keep a total cell fixed while dragging. - Percentage Change:
. - Percentage Difference:
. - Increase Value:
| Decrease Value:.
FAQs: People Also Ask
1. How do I calculate a percentage of a number in Excel?
To find a specific percentage of a number (e.g., “What is 20% of 5,000?”), simply multiply the number by the percentage.
Formula: (where A2 is 5,000 and B2 is 20%).
2. How do I calculate percentage contribution in a PivotTable?
You don’t even need a formula for this!
- Right-click any value in your PivotTable.
- Select Show Values As.
- Choose % of Grand Total.
3. Does the percentage formula work the same in Google Sheets?
Yes! Google Sheets uses the exact same logic and formulas as Excel. Whether it’s or the for absolute references, they are identical.
4. Why does my Excel percentage show as a decimal?
By default, Excel treats percentages as decimals (e.g., 0.5 = 50%). To fix this, select the cell and click the Percent Style (%) button in the Home tab.
5. How do I find the percentage increase between two numbers?
Subtract the old value from the new value, then divide the result by the old value.
Formula: .
Become A Data Analyst With Kaashiv Infotech
Looking to dive into the world of data analytics and carve your path to success? Kaashiv Infotech is here for you! Our specialized Data Analytics Inplant Training (IPT) and certification programs are meticulously crafted by industry veterans to arm you with the high-demand skills and practical exposure needed to dominate the competitive data analytics landscape.
Let’s break down our offerings to see what makes our program the gold standard for aspiring analysts:
- Live Industry Projects: Move beyond theoretical assignments. We provide two real-time industry projects per internship, ensuring you build a professional portfolio that demonstrates your ability to solve actual business problems.
- Elite Mentorship: Learn from the best in the business. Your training is led by Microsoft MVPs and Google-recognized experts, giving you access to the insider knowledge and strategies used at the highest levels of tech.
- Exclusive Triple Certification: Don’t just settle for one piece of paper. Stand out to recruiters with our comprehensive Triple Certification: an Internship Certificate, an IPT Certificate, and an Industrial Exposure Certificate.
- Specialized Inplant Training (IPT): Experience a curriculum designed to bridge the gap between academic learning and industrial application, focusing on the exact tools and workflows used in the corporate world.
- Interactive Doubt-Clearing Sessions: We ensure no student is left behind. Our regular, focused doubt sessions provide absolute clarity on complex concepts, ensuring you master every module.
- Hands-on Technical Mastery: Gain proficiency in industry-standard tools through a rigorous practical phase, transforming you from a learner into a practitioner.
- Industry-Aligned Curriculum: Our modules are constantly updated to reflect current market trends, ensuring you learn the skills that employers are actually hiring for today.
- Collaborative Learning Community: Engage with a network of ambitious peers and mentors, exchanging ideas and collaborating on data challenges to sharpen your analytical thinking.
- ATS-Friendly Resume Tools: Your skills deserve to be seen. We provide specialized tools to build ATS-friendly resumes that pass through automated filters and land directly on the recruiter’s desk.
- 100% Job Assistance + Interview Question Banks: We are committed to your employment. Benefit from our 100% job assistance guarantee and gain a competitive edge with our curated bank of real-world interview questions.
So what are you waiting for? Launch your career with confidence! Join the Kaashiv Infotech Data Analytics program and unlock your potential today.
Conclusion
Calculating percentages in Excel doesn’t have to be a headache. Once you understand the relationship between the “part” and the “total,” and learn how to use a few shortcuts like the format and absolute references (), you can handle almost any dataset thrown your way.
Whether you are managing a budget or analyzing business growth, these formulas are the building blocks of data literacy. Keep practicing, experiment with your own data, and don’t be afraid to break a few cells along the way—that’s how you learn!