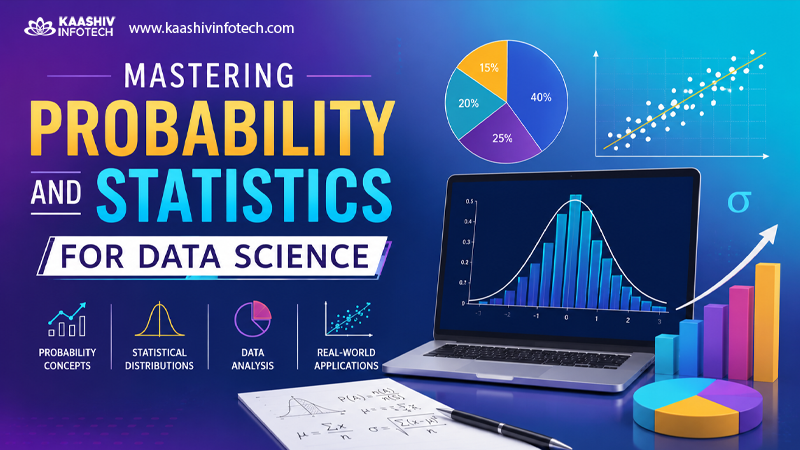
The Backbone of Data Science
In the modern world, data is everywhere—generated from apps, websites, sensors, businesses, and human interactions. But raw data alone has no meaning unless we can interpret it, extract insights, and make decisions from it. This is where Probability and Statistics for Data Science become essential.
Probability and statistics form the mathematical foundation of data science. They help us understand uncertainty, uncover hidden patterns, validate assumptions, and build predictive models. Whether you’re working on machine learning, business analytics, or artificial intelligence, these concepts are not optional—they are fundamental.
This guide will take you deep into the core concepts, explaining not just what they are, but how they are used in real-world data science.
Understanding Probability
🔍 What is Probability?
Probability is a way to measure uncertainty. It tells us how likely something is to happen. Every event in the real world—whether it’s a user clicking a link, a stock price rising, or rain falling—has some level of uncertainty.
Probability values range from 0 to 1. A value close to 0 means the event is very unlikely, while a value close to 1 means it is very likely. In data science, probability allows us to model uncertainty mathematically so that we can make informed decisions.
For example, when a recommendation system predicts what movie you might like, it is essentially assigning probabilities to different choices.
🔗 Core Probability Concepts
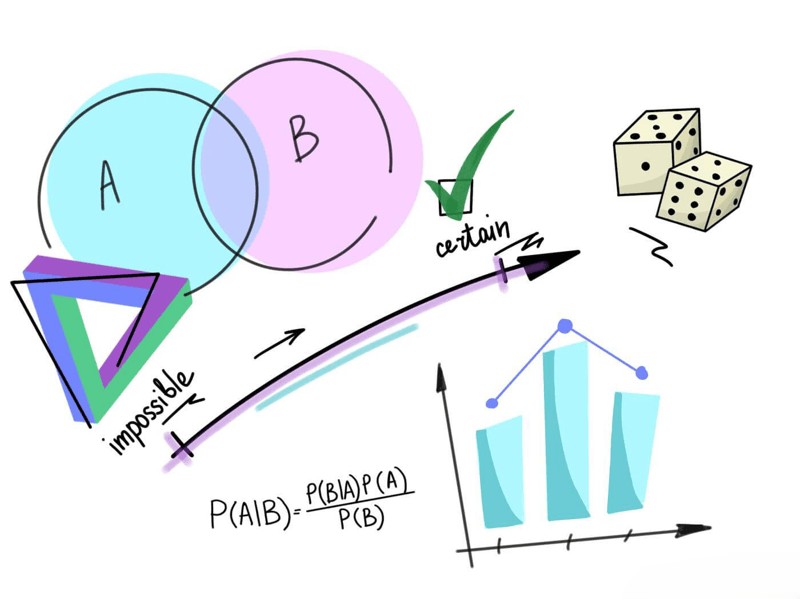
Conditional Probability
Conditional probability is used when the occurrence of one event affects another. Instead of looking at events in isolation, it answers questions like: What is the probability of A happening given that B has already happened?
This concept is crucial in real-world applications such as fraud detection and medical diagnosis, where prior information significantly changes outcomes.
Independent and Dependent Events
In probability, understanding whether events are independent is critical. Independent events do not influence each other. For instance, tossing a coin twice—the result of the first toss does not affect the second.
However, in data science, many variables are dependent. For example, a customer’s purchase behavior may depend on their past interactions.
Bayes’ Theorem
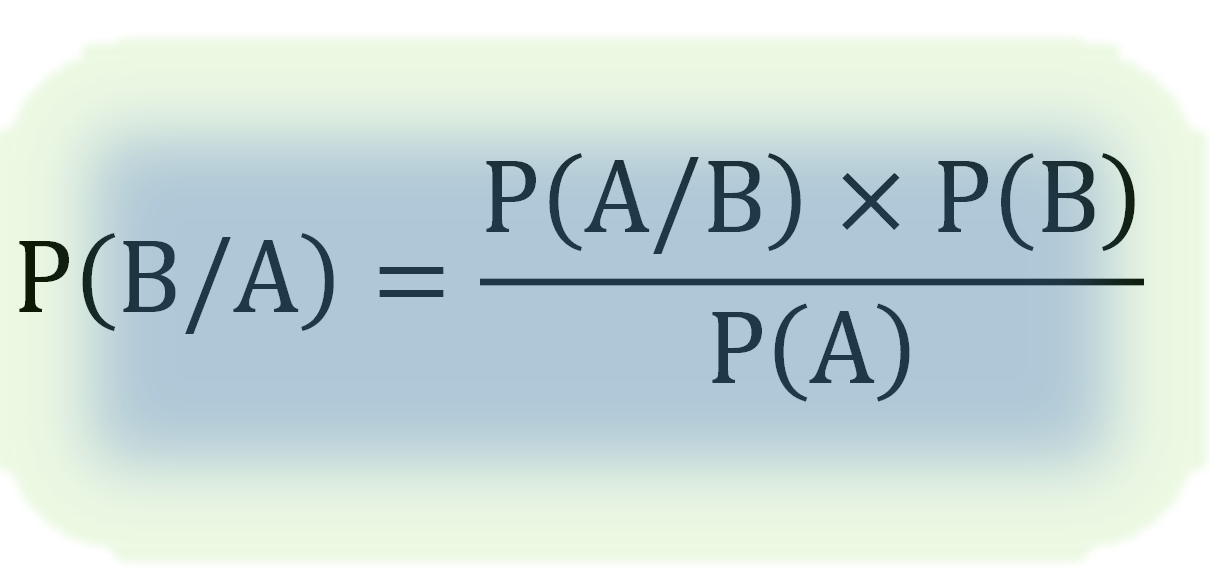
Bayes’ Theorem is one of the most powerful tools in probability. It allows us to update our beliefs when new evidence is available. Instead of starting from scratch, it refines predictions based on prior knowledge.
This is widely used in machine learning algorithms like Naive Bayes classifiers, spam filters, and recommendation engines. The idea is simple but powerful: the more data you observe, the smarter your predictions become.
🎲 Random Variables and Distributions
A random variable is a way to assign numerical values to outcomes of a random process. In data science, almost everything is modeled as a random variable—from user clicks to revenue.
Random variables can be discrete or continuous. Discrete variables take countable values, like the number of users visiting a website. Continuous variables represent measurements, like time spent on a page.
To understand how these variables behave, we use probability distributions. A distribution describes how values are spread. The normal distribution, often called the bell curve, is especially important because many real-world phenomena follow it.
Descriptive Statistics – Understanding Data
📈 What is Descriptive Statistics?
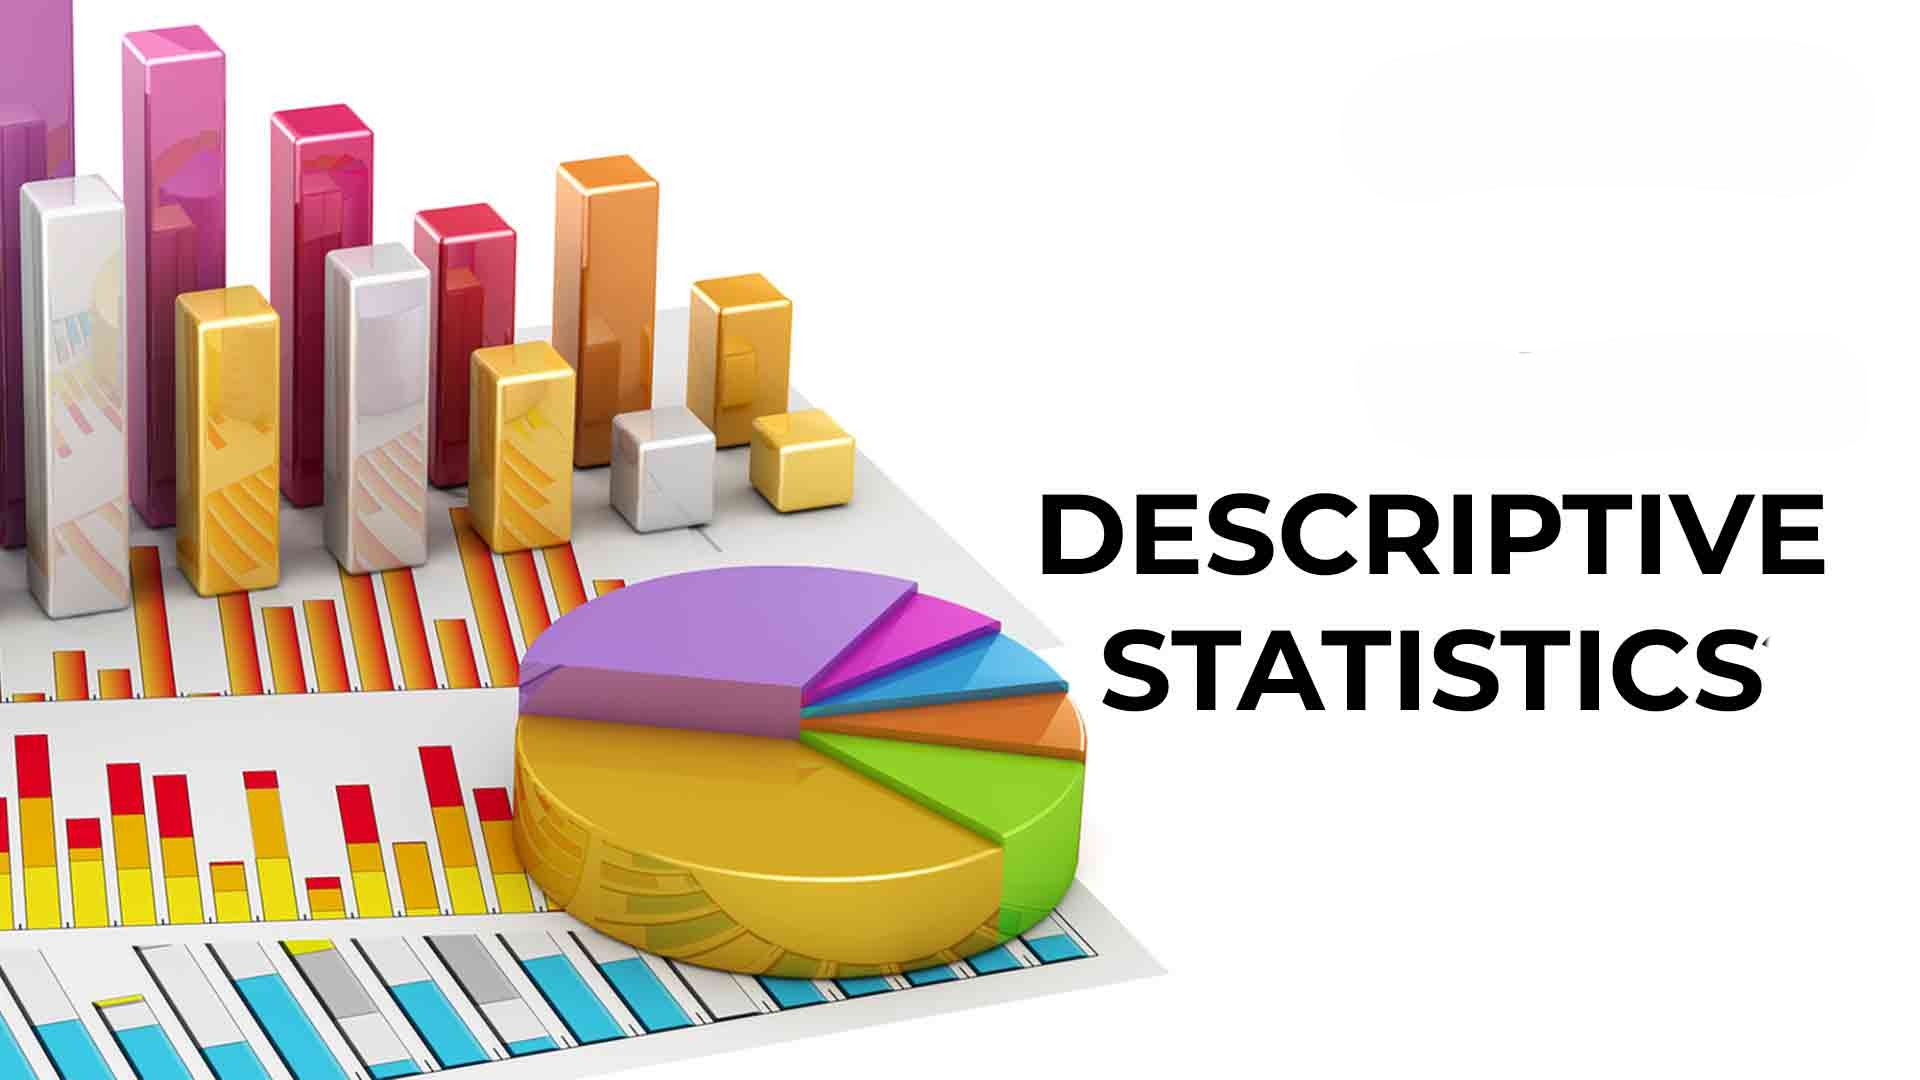
Descriptive statistics focuses on summarizing and organizing data so that it becomes easier to understand. Instead of looking at raw numbers, we extract meaningful summaries that reveal patterns and trends.
📍 Central Tendency: The Center of Data
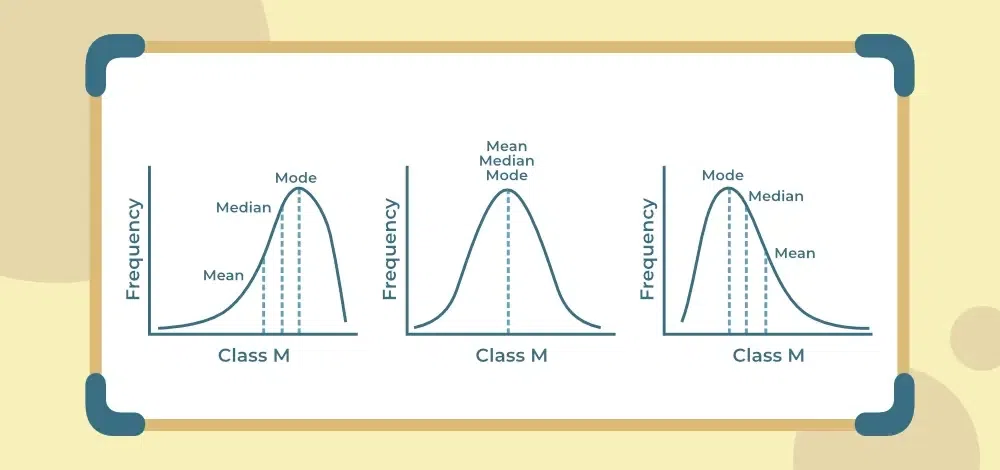
The concept of central tendency helps us understand where the data is centered. The mean gives the average value, the median represents the middle point, and the mode identifies the most frequent value.
In real-world datasets, the mean is not always reliable—especially when outliers are present. For example, in income data, a few extremely high salaries can distort the average. In such cases, the median provides a better representation.
📉 Variability: Understanding Data Spread
While central tendency tells us where data lies, variability tells us how spread out it is. Two datasets can have the same average but very different distributions.
Standard deviation is one of the most important measures in data science. A low standard deviation means data points are close to the mean, while a high value indicates more spread.
Understanding variability is essential in risk analysis, anomaly detection, and performance evaluation.
📊 Data Distribution Shapes
Not all datasets follow a perfect bell curve. Some are skewed, meaning values are stretched more on one side. Others may contain outliers—extreme values that can significantly affect analysis.
Recognizing distribution patterns helps data scientists choose the right models and avoid misleading conclusions.
Inferential Statistics – Making Predictions
🔍 From Sample to Population
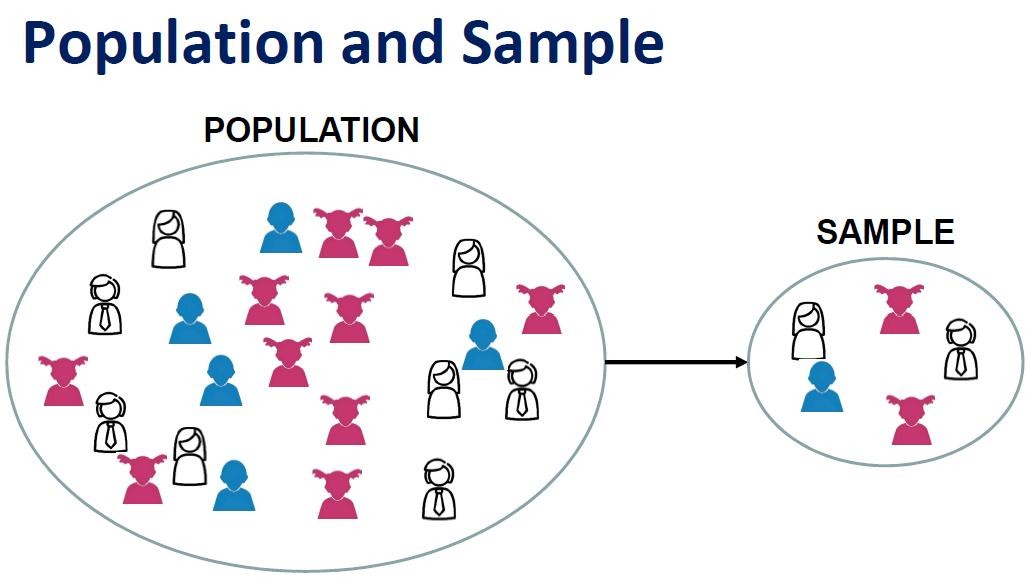
In most cases, analyzing an entire population is impossible. Instead, data scientists work with samples and use inferential statistics to draw conclusions about the whole population.
The accuracy of these conclusions depends heavily on how well the sample represents the population.
🧪 Hypothesis Testing
Hypothesis testing is a structured method for making decisions using data. It starts with an assumption (null hypothesis) and tests whether the data provides enough evidence to reject it.
This process is widely used in A/B testing, product optimization, and scientific research.
📊 Confidence Intervals and P-Values
A confidence interval provides a range within which the true value is likely to lie. Instead of giving a single estimate, it acknowledges uncertainty.
The p-value helps determine the strength of evidence against the null hypothesis. Smaller p-values indicate stronger evidence.
Together, these concepts help data scientists make decisions with statistical confidence rather than guesswork.
Probability & Statistics in Machine Learning
🔗 Connecting Math to Models
Machine learning is essentially applied statistics. Every model—from linear regression to deep learning—relies on statistical principles.
Regression models predict continuous outcomes, such as prices or demand. Classification models assign categories, such as spam detection or disease prediction.
📉 Correlation and Relationships
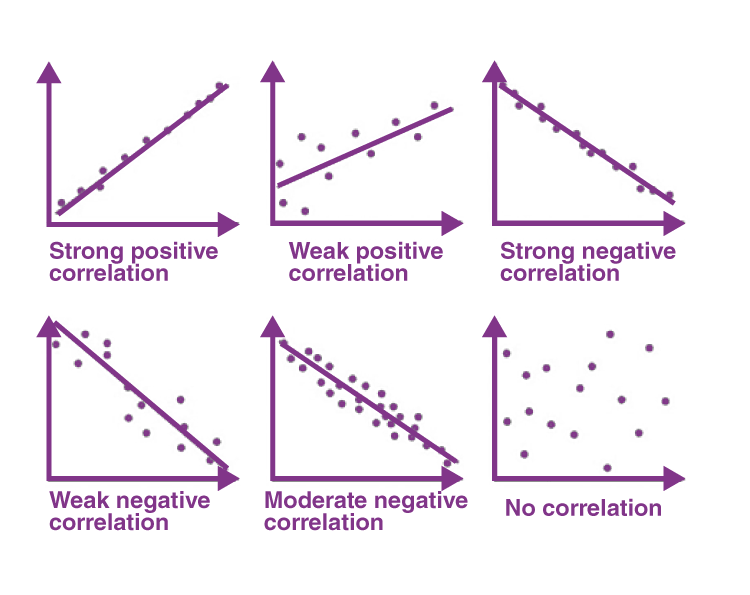
Correlation measures how strongly two variables are related. A strong correlation can indicate a useful relationship, but it does not imply causation.
Understanding this distinction is critical. Misinterpreting correlation can lead to incorrect conclusions and flawed models.
📊 Model Evaluation
To ensure models perform well, we use evaluation metrics such as accuracy, precision, recall, and F1 score. These metrics help determine how well predictions match reality.
Statistical thinking is essential here—especially when dealing with imbalanced datasets or noisy data.
Real-World Applications
Probability and statistics are not just theoretical—they power real-world systems used by millions of people.
In business, they help forecast sales and understand customer behavior. In healthcare, they assist in diagnosing diseases and predicting patient outcomes. In finance, they are used to detect fraud and manage risk. In technology, they drive recommendation engines and search algorithms.
Every time you see personalized content online, there is a statistical model working behind the scenes.
Tools Used by Data Scientists
Modern data science relies on powerful tools that implement statistical concepts efficiently. Python is the most popular language, supported by libraries like NumPy, Pandas, and SciPy for computation, and Matplotlib or Seaborn for visualization.
Machine learning frameworks such as Scikit-learn build directly on statistical foundations, making it easier to apply complex algorithms to real-world problems.
🧠 Final Thoughts
Probability and statistics are not just academic subjects—they are the language of data. They help you move from raw numbers to meaningful insights and from uncertainty to informed decisions.
Mastering these concepts takes time, but the reward is immense. You gain the ability to think critically, analyze data effectively, and build intelligent systems that can predict and adapt.
In data science, tools may change and technologies may evolve, but probability and statistics remain constant. They are the foundation upon which everything else is built.
Want to learn more ?, Kaashiv Infotech Offers, Data Science Course, Data Analytics Course, Power BI & More, Visit Our Website course.kaashivinfotech.com.


