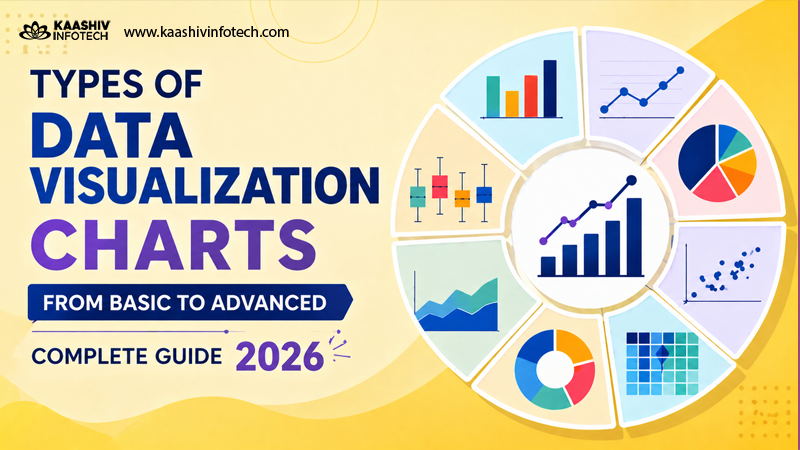
Tableau Project Ideas – If you want to master Tableau and stand out in the data analytics field, working on real-world projects is the fastest way to build practical skills. Whether you’re a beginner or an aspiring data analyst, these Tableau project ideas will help you understand data visualization, storytelling, and dashboard design in depth.
In this guide, you’ll explore 10 powerful Tableau projects, each with explanations, key features, and example visuals to inspire your work.
1. Sales Performance Dashboard

This project focuses on analyzing sales data across different regions, time periods, and product categories. You will create an interactive dashboard that highlights trends, top-performing products, and revenue insights. It helps you learn core Tableau features like filters, calculated fields, and data storytelling.
Description:
Create an interactive dashboard to analyze sales data across regions, products, and time periods.
Key Features:
- Monthly and yearly sales trends
- Region-wise performance
- Top-performing products
- Profit vs revenue comparison
Why This Project?
This project helps you understand core Tableau concepts like filters, calculated fields, and dashboards.
2. COVID-19 Data Analysis Dashboard

Description:
Analyze global pandemic data to track cases, recoveries, and deaths. In this project, you visualize global COVID-19 data to track cases, recoveries, and deaths. You’ll build maps and time-series charts to show trends across countries. This improves your ability to work with real-time datasets and geographic visualizations in Tableau.
Key Features:
- Country-wise case comparison
- Trend analysis over time
- Recovery and fatality rates
- Interactive map visualization
Why This Project?
It improves your ability to work with real-time datasets and geographic visualizations.
3. Customer Segmentation Analysis

Description:
Segment customers based on purchasing behavior using clustering techniques. This project involves grouping customers based on their purchasing behavior and demographics. You’ll use clustering and segmentation techniques to identify different customer types. It helps you understand advanced analytics concepts and how businesses target specific audiences.
Key Features:
- Customer groups based on spending
- Demographic analysis
- Behavioral insights
- Cluster visualization
Why This Project?
This project introduces advanced analytics concepts like clustering and segmentation.
4. Financial Performance Dashboard

Description:
Build a dashboard to track company financial metrics. This project helps you track financial metrics like revenue, expenses, and profit margins. You’ll build dashboards that compare yearly growth and budget vs actual performance. It is useful for understanding business finance and creating professional dashboards.
Key Features:
- Revenue vs expenses
- Profit margins
- Year-over-year growth
- Budget vs actual comparison
Why This Project?
It strengthens your understanding of financial KPIs and business intelligence.
5. HR Analytics Dashboard

Description:
Analyze employee data to improve workforce management. In this project, you analyze employee data to gain insights into workforce trends. The dashboard can show attrition rates, hiring patterns, and salary distribution. It is widely used in companies to improve employee management and decision-making.
Key Features:
- Employee attrition rate
- Department-wise performance
- Hiring trends
- Salary distribution
Why This Project?
This project is widely used in real-world corporate environments.
6. E-Commerce Analytics Dashboard

Description:
Analyze online shopping data to improve sales and customer experience, This project focuses on analyzing online sales data, including customer behavior and product performance. You’ll create visualizations for order trends, shipping data, and revenue insights. It helps you understand how businesses optimize online sales strategies.
Key Features:
- Order trends
- Customer behavior
- Product performance
- Shipping analysis
Why This Project?
It gives exposure to real-world business data and decision-making.
7. Stock Market Analysis Dashboard

Description:
Visualize stock price movements and trends. Here, you visualize stock prices and trends over time using line charts and indicators. You can include moving averages and volume analysis to understand market behavior. This project strengthens your skills in time-series data and financial analytics.
Key Features:
- Stock price trends
- Volume analysis
- Moving averages
- Company comparisons
Why This Project?
You’ll learn time-series analysis and financial data visualization.
8. Social Media Analytics Dashboard

Description:
Track engagement metrics from platforms like Instagram or Twitter. This project analyzes engagement metrics such as likes, shares, comments, and follower growth. You’ll create dashboards that show content performance and audience interaction. It is useful for understanding digital marketing and social media strategies.
Key Features:
- Likes, shares, comments
- Follower growth
- Engagement rate
- Content performance
Why This Project?
Helps in understanding marketing analytics and digital trends.
9. Supply Chain Management Dashboard

Description:
Monitor logistics and supply chain performance. In this project, you monitor logistics data such as inventory levels, delivery timelines, and supplier performance. The dashboard helps identify delays and inefficiencies in the supply chain. It is valuable for operations and logistics analysis.
Key Features:
- Inventory levels
- Delivery timelines
- Supplier performance
- Cost analysis
Why This Project?
Useful for understanding operations and logistics data.
10. Student Performance Dashboard

Description:
Analyze academic performance data. This beginner-friendly project focuses on analyzing academic data like marks, attendance, and subject performance. You’ll build dashboards to compare students and track progress over time. It helps you practice basic visualization techniques with meaningful data.
Key Features:
- Subject-wise scores
- Attendance tracking
- Performance trends
- Student comparison
Why This Project?
Great beginner-friendly project with meaningful insights.
Tips to Make Your Tableau Projects Stand Out
Instead of just building dashboards, focus on storytelling and usability.
- Use clean and minimal design
- Add interactive filters and parameters
- Highlight key insights clearly
- Use appropriate charts (bar, line, map, etc.)
- Optimize dashboards for performance
Conclusion
Working on these Tableau project ideas will help you move from basic visualization to advanced data storytelling. Each project not only improves your technical skills but also prepares you for real-world data analyst roles.
Start with simple dashboards like sales or student performance, then gradually move toward advanced projects like customer segmentation or supply chain analytics.
If you consistently build and showcase these projects in your portfolio, you’ll significantly increase your chances of landing a job in data analytics.
From beginners to pros, mastering this skill boosts your confidence and ensures your work is always neat and reliable, don’t let duplicates slow you down — clean them up like a pro! Want to learn more ?, Kaashiv Infotech Offers, Excel Course, Data Analytics Course, Power BI & More, Visit Our Website course.kaashivinfotech.com.