
Imagine you are running a marketing campaign and you look at your data. You see that more women clicked on your ad than men.. You wonder if this is a real trend or if it just happened by chance.
When you are dealing with numbers and percentages it is easy to see patterns that’re not really there. To stop guessing and start knowing people who analyze data use a tool called the Chi Square Test.
Whether you are a data analyst, a university student or a business owner trying to make sense of survey results understanding the Chi Square Test is very important. In this guide we are going to break down everything you need to know about the Chi Square Test: Formula, Types and Examples in language.
Lets dive into the world of data.
What is the Chi Square Test?
In terms the Chi Square test is a way to figure out if there is a big difference between what you expected to happen and what actually happened in your data.
It is used for data, which is data that can be grouped into categories like colors, genders or product types. The Chi Square test does not care about the distribution of your data. It only cares about the counts within your categories.
The Core Formula
The math behind the test might look hard at first. It is actually quite logical. The Chi Square value is calculated using this formula:
χ2=∑(O.E)2E
Here is what this formula means:
- χ2: The Chi Square value.
- ∑: The sum of meaning you add up all your categories.
- O: The observed frequency, which is the data you collected.
- E: The expected frequency, which is the data you would expect to see if there was no relationship.

Why Do We Need the Chi Square Test?
You might wonder why you cannot just look at a chart and decide. Charts are great. They are not mathematical proof. Here is why the Chi Square test is important in data analysis:
- Testing Expectations: It tells you if a single variable follows a predicted pattern. For example if a store sells four flavors of ice cream do customers like them all equally?
- Finding Hidden Relationships: It reveals if two categories are linked. For instance does a persons age group influence whether they prefer shopping in-store?
Types of Chi Square Tests
There are different types of Chi Square tests because not all data problems are the same. Depending on what you’re trying to find out you will use one of these three main types:
1. Chi Square Goodness of Fit Test
This test looks at a categorical variable to see if the actual distribution of data fits a theoretical expectation.
- Example: A casino claims their dice are fair. You roll the die 60 times. Use this test to see if the actual rolls match the expected 10 rolls per number.
2. Chi Square Test of Independence
This test compares two variables to see if they are related or independent.
- Example: You want to know if favorite movie genre is related to gender. If they are independent knowing someones gender gives you no clue about their movie preference.
3. Chi Square Test of Homogeneity
This test is similar to the test of independence. It is used to compare different populations to see if they share the same proportions of a single variable.
- Example: Comparing voting preferences between three cities.

The Golden Rules: Assumptions of the Chi Square Test
Before you start using the Chi Square test your data must pass a basic checks. If it does not your results will be invalid.
- Data Must Be Categorical: You cannot use this test for data like exact height or salary.
- Observations Must Be Independent: One data point cannot influence another.
- Expected Frequencies Must Be Enough: The expected value in every category should be at least 5.
Step by Step Chi Square Test: Formula, Types and Examples in Action
Lets put the theory into practice with two examples.
Example 1: Goodness of Fit Test
Imagine you own a coffee shop. You sell three types of pastries: muffins, brownies and cookies. You assume your customers like all three equally. Over a week you sell 90 pastries.
- Expected: 30 of each type.
- Observed: 40 muffins, 20 brownies and 30 cookies.
Lets use the formula: χ2=∑(O.E)2E
- Muffins: (40.30)2/30=100/30=3.33
- Brownies: (20.30)2/30=100/30=3.33
- Cookies: (30.30)2/30=0
Total Chi Square Value = 3.33+3.33+0=6.66
Example 2: Test of Independence
A tech store wants to know if there is a relationship between a customers age group and the brand of phone they buy. They survey 100 customers.
Here is the observed data:
- Under 30: 30 bought brand A, 20 bought brand B.
- 30: 15 bought brand A, 35 bought brand B.
Step 1: Calculate the Values
- Under 30 and brand A: (50×45)/100=22.5
- Under. Brand B: (50×55)/100=27.5
- Over. Brand A: (50×45)/100=22.5
- Over 30 and brand B: (50×55)/100=27.5
Step 2: Apply the Chi Square Formula
- Under 30 and brand A: (30.22.5)2/22.5=2.5
- Under 30 and brand B: (20.27.5)2/27.5=2.04
- Over. Brand A: (15.22.5)2/22.5=2.5
- Over 30 and brand B: (35.27.5)2/27.5=2.04
Total Chi Square Value = 2.5+2.04+2.5+2.04=9.08
How to Interpret Your Results
The Chi Square test is a tool for analyzing categorical data. By following the steps and examples outlined in this guide you can use the Chi Square test to make decisions and gain valuable insights from your data. Remember to check the assumptions of the test and interpret your results carefully. With practice you will become proficient, in using the Chi Square test to unlock the secrets of your data. The Chi Square test will help you understand the Chi Square test. The Chi Square test is used for the Chi Square test.
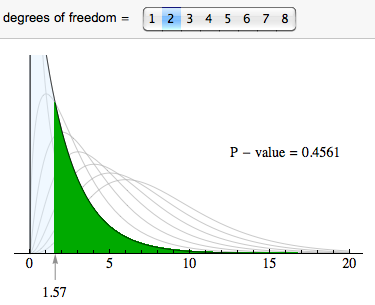
Now that you have your Chi-Square number what does it mean? A number by itself does not mean anything unless you compare it to a standard.
To find out if your result is statistically significant you look at two things: Degrees of Freedom (df) and the p-value of the Chi-Square test.
- Degrees of Freedom: This relates to how categories you have in the Chi-Square test. For a goodness-of-fit test it is the number of categories minus one. For our coffee shop df = 3.1=2.
- The Magic P-Value of the Chi-Square test: Data analysts use a threshold, usually 0.05.
- If your p-value of the Chi-Square test is ** than 0.05** you reject the null hypothesis of the Chi-Square test. This means the pattern is real. Age does affect phone choice or your customers do prefer muffins over brownies.
- If your p-value of the Chi-Square test is greater than 0.05 you fail to reject the hypothesis of the Chi-Square test. The differences you see are just random chance.
(Note: In the world you do not calculate the p-value of the Chi-Square test by hand. Softwares like Python, R or even Excel will automatically tell you if your Chi-Square value results in a p-value below 0.05!)

Real-World Applications of the Chi-Square test
The Chi-Square test is not for textbooks. It is used every day across various industries:
- Market Research: Do people in different cities prefer different subscription plans? Companies use the Chi-Square test to tailor their advertising.
- Medical Studies: Is a drug more effective than a placebo? Researchers categorize patients as “Recovered” or “Not Recovered” to see if the treatment group had better outcomes using the Chi-Square test.
- A/B Testing in Tech: Did the red “Buy button get more clicks than the blue button or was it just a coincidence? The Chi-Square test gives developers the answer.
Watch Out for the Limitations of the Chi-Square test
powerful as the Chi-Square test is it has its limitations:
- Small Samples: If your expected count drops below 5 in a category the Chi-Square test gets wobbly and inaccurate. In these cases analysts use an alternative called Fisher’s Exact Test.
- It Does Not Tell You “Why”: The Chi-Square test might prove that gender and movie preference are linked. It will not tell you why they are linked nor will it tell you the strength of that connection.
Become A Data Analyst With Kaashiv Infotech
Looking to dive into the world of data analytics and carve your path to success? Kaashiv Infotech is here for you! Our specialized Inplant Training (IPT) and comprehensive Certification Courses (including Python course in chenni, Data Analytics course in chennai, and AI course in chennai) are specially designed by top-tier experts to equip you with practical skills and real-world experience that will help you set your foot in the highly competitive data analytics industry.
Let’s break down our training offerings to see what makes our program stand out:
- Live Industry Projects: You’ll work on a variety of complex datasets to build a solid portfolio, enhancing your learning with exactly 2 real-time projects per internship that perfectly showcase your analytical skills to future employers.
- Practice Exercises: Get hands-on practice with daily technical exercises that enhance your learning and help you master key concepts like data visualization, cleaning, and statistical modeling.
- Doubt Clearing Sessions: Our regular doubt sessions ensure that no question goes unanswered, giving you complete clarity on all data science and analytics tools.
- Kaashiv Tech Lab for Coding: Access our exclusive coding environments to practice and polish your Python, R, and SQL coding skills in a highly supportive setting.
- Industry-Oriented Curriculum: Learn industry-relevant analytical skills and techniques that are directly applicable to real-world corporate scenarios.
- Exclusive Triple Certification: Earn our highly valued Triple Certification upon completion—an Internship Certificate, an IPT Certificate, and an Industrial Exposure Certificate—recognized and respected by employers across the tech industry.
- Interactive Tech Forums: Engage with fellow batchmates and mentors in our tech forums to exchange ideas, seek coding advice, and collaborate on data-driven projects.
- Instructor-Led Sessions: Benefit from highly interactive sessions led directly by Microsoft MVPs and Google-recognized experts who guide you every step of the way.
- Advanced Career Tools: Gain access to extensive data analytics interview question banks and our customized ATS-friendly resume building tools to help you seamlessly land your dream job.
- 100% Job Assistance Guarantee: We’re offering 100% job assistance along with ongoing career support and placement guidance from our dedicated corporate network.
So what are you waiting for? Launch your data career with confidence! Join Kaashiv Infotech’s Data Analytics Inplant Training and Certification program and unlock your potential today.
Conclusion
Understanding data is no longer a skill for mathematicians; it is a necessity for modern business, marketing and technology. The Chi-Square Test gives you a mathematically sound way to look at categorical data and say, “Yes this pattern is real ” or “No this is just a coincidence.”
By mastering the concepts of expected versus frequencies you are taking a massive step toward becoming a truly data-driven decision-maker.
Are you fascinated by the stories data can tell? If you want to turn this interest into a paid career mastering statistical tools like the Chi-Square test is just the beginning. At Kaashiv Infotech we provide cutting-edge hands-on training to help you master Data Analytics, Machine Learning and more. Take the leap learn from industry experts and future-proof your career today!
Frequently Asked Questions (People Ask)
1. What is a Chi-Square test used for?
The Chi-Square test is a tool used to analyze categorical data. It helps determine if there is a difference between the expected frequencies and the observed frequencies in one or more categories proving whether patterns in data are real or just random chance.
2. How do you calculate the Chi-Square formula?
You calculate it by taking your data subtracting your Expected data squaring the result and dividing that by the Expected data. You do this for every category. Add all the results together. The formula is: χ2=∑(O.E)2E.
3. What is the difference between Goodness-of-Fit and Independence tests?
The Goodness-of-Fit test looks at a categorical variable to see if it matches a theoretical expectation. The test of Independence compares two categorical variables to see if they are related.
4. What is a p-value for a Chi-Square test?
In statistics the standard threshold for a “p-value is generally anything less than 0.05. A p-value < 0.05 indicates that your results are statistically significant meaning the relationship or difference you observed is highly unlikely to be due to chance.
5. Can I use a Chi-Square test for sample sizes?
Generally no. The Chi-Square test loses its accuracy if your sample size is too small. The standard rule is that the expected frequency in every category must be at least 5. If it is smaller, than 5 data analysts typically use a method called Fishers Exact Test.